| Nick Shulman responded: |
2025-07-07 13:46 |
Can you send us your Skyline document?
In Skyline you can use the menu item:
File > Share
to create a .zip file containing your Skyline document and supporting files including extracted chromatograms.
The Share Document dialog also gives you the option of including the raw data, which would be helpful in this case.
Files which are less than 50MB can be attached to these support requests.
You can always upload larger files here:
https://skyline.ms/files.url
I am not sure why Skyline would be picking that peak which does not actually overlap with the Explicit Retention Time.
Usually, when people have specified an Explicit Retention Time the complaint is the opposite: Skyline will always choose a detected peak which overlaps with the Explicit Retention Time, no matter how low quality the peak is on other dimensions.
If you want to learn more about why Skyline chose a particular peak, the Candidate Peaks window is useful. You can get to that window with the "View > Live Reports > Candidate Peaks". That window will show you the peaks that Skyline detected and how they scored.
After we see your Skyline document we will be able to give you more information about why Skyline is doing what it is doing.
-- Nick |
| |
| sophia responded: |
2025-07-07 13:56 |
Thank you for taking a look.
I've uploaded the file to linked location, filename: HILIC-W44-1-2_2ndpass.sky.zip |
| |
| Nick Shulman responded: |
2025-07-07 14:15 |
Thank you for uploading that Skyline document.
Can you tell me which molecule and replicate you were looking at in your screenshots?
-- Nick |
| |
| sophia responded: |
2025-07-08 05:48 |
Choline_light
The screenshot with the wrong assignment came from sample I5_pos
An example of the correct assignment is sample H7_pos |
| |
| Nick Shulman responded: |
2025-07-08 10:26 |
I think you might have set the "Explicit Retention Time" after already having imported chromatograms.
If you make a change like that which affects Skyline's opinion of the peaks that it has detected, you often need to use either the "Rescore" or "Reimport" button on the "Edit > Manage Results" dialog.
By the way, when you collect data for each sample in multiple injections like you have in this document where each sample has a "pos" and "neg" file, it works better if you tell Skyline to put the two files in the same Replicate.
When you do "File > Import > Results" the first window asks you how to organize multiple injection files as replicates.
-- Nick |
| |
| sophia responded: |
2025-07-08 11:34 |
Thanks. I re-imported it, but I'm still seeing issues like this one (same analyte as before). I'm not sure why it's picking the other peak when the RT set is closer to the apex of the other, correct peak |
|
| |
| Nick Shulman responded: |
2025-07-08 11:42 |
Can you send me the file for that Replicate that is "079_Week44-SP1-Plate02_sample_I5_pos.mzML"?
You can upload it here:
https://skyline.ms/files.url
-- Nick |
| |
| sophia responded: |
2025-07-08 11:53 |
Uploaded 079_Week44-SP1-Plate02_sample_I5_pos.mzML.zip |
| |
| sophia responded: |
2025-07-08 12:13 |
I am not sure re-importing it actually changed anything. The R^2s of my curves are all exactly the same as they were before I re-imported. |
| |
| Nick Shulman responded: |
2025-07-08 12:38 |
Thank you for uploading that .mzML file.
I see that Skyline does not detect any peaks for that molecule when I reimport that .mzML file.
The reason for this is that the Explicit Retention Time window is 0.1 minutes.
The Explicit Retention Time Window constrains where Skyline can detect peaks.
Skyline did not find any peaks within 0.1 minutes of 4.7.
If you change that Explicit Retention Time window value to a larger number such as 0.5, then Skyline will detect a peak.
I am not sure exactly what number Skyline is looking at when it decides that the peak it does detect is more than 0.1 minutes away from 4.7.
-- Nick |
| |
| sophia responded: |
2025-07-10 07:24 |
Thanks, Nick! I have widened it for this analyte, and it looks better.
I am still seeing other analytes like this, though, where it's not picking the right peak. I can see the peak at 3.3 min with a low ppm error, and it's picking something quite far away with a high ppm error, even though I have it set to 3.3 min with a RT window of 0.1 min.
You said, "I am not sure exactly what number Skyline is looking at when it decides that the peak it does detect is more than 0.1 minutes away from 4.7."
Does this mean you don't understand what is causing this behavior? |
|
| |
| sophia responded: |
2025-07-10 07:27 |
I am also seeing a lot of this, where it's clearly not integrating the whole peak. Is there any way to fix this apart from going through individually adjusting the integration? I simply cannot do that for a huge dataset like this, it will literally take me days |
|
| |
| sophia responded: |
2025-07-10 07:33 |
Why is this peak being picked when it's clearly just not in the sample? This is outside my RT window, and also high ppm error. |
|
| |
| sophia responded: |
2025-07-10 08:52 |
Another example -- why is it not picking the peak within the RT window that is obviously correct? |
|
| |
| Nick Shulman responded: |
2025-07-10 09:01 |
Can you upload your Skyline document again?
In Skyline you can use the menu item:
File > Share
to create a .zip file containing your Skyline document and supporting files including extracted chromatograms.
The Share Document dialog gives you the option to include the raw (or mzML) files.
For peak picking bugs like this, it would be helpful if you could send us the raw files.
You can upload the zip file here:
https://skyline.ms/files.url
-- Nick |
| |
| sophia responded: |
2025-07-10 09:51 |
Uploaded HILIC-W44-1-2_reimport.zip |
| |
| Nick Shulman responded: |
2025-07-10 10:35 |
The .zip file that you uploaded is missing a few important things like the .skyd file.
Can you try creating it again?
-- Nick |
| |
| sophia responded: |
2025-07-10 11:34 |
Sorry about that.
Uploaded HILIC-W44-1-2_reimport.sky |
| |
| Nick Shulman responded: |
2025-07-10 13:18 |
In that Screenshot 2025-07-10 at 10.22.55 AM.png image, the peak was chosen by the user.
You can tell that because there is a little bit of purple visible on the graph. The purple rectangle shows where Skyline originally placed the peak boundaries before the user moved them.
You can hide/show the purple shaded rectangle by right-clicking on the chromatogram graph and choosing "Original Peak".
If you want to discard all of the manual peak adjustments that you may have done you can use the "Refine > Reintegrate" menu item.
On the Reintegrate dialog, check the checkbox that says "Overwrite manual integration".
After you OK the Reintegrate dialog, Skyline will move all the peak boundaries back to what Skyline would have chosen immediately after importing results.
When you tell Skyline to reimport results using the "Reimport" button on the Manage Results dialog, Skyline preserves all manually adjusted peak boundaries. So, if you want to get back to a clean set of peak boundaries chosen by Skyline you should use the "Overwrite manual integration" checkbox on the Reintegrate dialog.
Let me know if you see any incorrectly chosen peaks after telling Skyline to reintegrate.
It would be more helpful if you could take screenshots of the entire Skyline window so I can see which molecule and replicate you have selected.
-- Nick |
| |
| sophia responded: |
2025-07-11 07:09 |
Ok, thanks. This seems to have greatly improved it. I inherited this Skyline file and I did not realize there were all these manual integrations made.
However, I am still seeing instances where it's not picking the correct peak, or not integrating the full peak to my eye. See examples below. I am unclear why it's sometimes selecting a peak with a high ppm error as the correct peak. In my transition settings, I have an ion match tolerance of 25 ppm, but sometimes the peak it's picking has a higher ppm error than that. In that case, I want it to disregard that peak, or choose the other peak in the RT window range. Why isn't it doing that?
Attached examples of incompletely integrated peaks or incorrectly chosen peaks.
I uploaded my file HILIC-W44-1-2_reimport_original_reintegrated.sky.zip |
|
| |
| Nick Shulman responded: |
2025-07-11 09:21 |
When the chromatogram is jagged like that, Skyline often has trouble figuring out where the peak boundaries should go, and often chooses a local minimum instead of a more global minimum that you would have preferred it to have chosen.
Unfortunately, we have never managed to figure out a way to fix behavior like that, because anything that we might do to change the behavior would end up making a lot of other scenarios worse.
In one of your screenshots I see that Skyline has set the peak boundaries much wider than you would expect, and put them at a place where there was literally no signal in the visible chromatograms.
I believe the reason that Skyline is doing that has to do with the M-1 chromatogram.
Whenever Skyline extracts MS1 chromatograms, Skyline always extracts chromatograms for the entire isotope envelope including the M-1 chromatogram. The "Isotope Peaks Included" setting on the "Full Scan" tab in Transition Settings controls the set of transitions that you see in the Targets tree, but Skyline always extracts chromatograms for the entire isotope envelope regardless of that setting.
You can see these hidden chromatograms by right-clicking on the Precursor in the Targets tree and choosing "Pick Children".
You will need to turn off the filter which you can do by clicking the button that looks like an inverted triangle in the child picker window.
I have attached a screenshot which shows that M-1 chromatogram in the Ethoxyacetic acid molecule.
Unfortunately, I cannot think of a way to improve Skyline's behavior in these scenarios.
-- Nick |
|
| |
| sophia responded: |
2025-07-11 09:29 |
Ah, thanks.
What about the cases where it is picking a peak that has a ppm tolerance outside of the ion tolerance? Is there a way to force it not to do that? Is ion tolerance not the right place to set the ppm tolerance? |
| |
| Nick Shulman responded: |
2025-07-11 09:45 |
The "Ion match tolerance" setting on the Library tab of Transition Settings only affects the way that Skyline interprets MS2 spectra in spectral libraries.
When Skyline looks at a library spectrum, Skyline needs to figure out whether the signal in the library spectra corresponds to a known transition, such as the y7+ fragment ion from a peptide. The "Ion match tolerance" controls how close the m/z in the library spectrum needs to be to the calculated m/z of the Transition in order for it to be a match.
There is not really a setting that controls how close the mass error needs to be.
The only setting which comes close is the "Resolving power" setting on the "Full Scan" tab in Transition Settings.
The Resolving power setting controls how wide of a m/z channel Skyline sums across when extracting chromatograms.
If you increase the resolving power then Skyline will sum across a narrower channel.
In that way, if the observed m/z is farther from the predicted m/z, then choosing a higher resolution will cause the extracted ion intensity to be a smaller number or zero.
If you click on a point along the chromatogram, Skyline will bring up a spectrum viewer which shows you the spectrum that contributed to that extracted point on the chromatogram.
That spectrum graph shows highlighted regions around the transition m/z's which show the width of the m/z channel that Skyline summed across.
When you look at that graph you might see that increasing the resolution would have caused Skyline to not see the signal that you were hoping it would ignore.
-- Nick |
| |
| sophia responded: |
2025-07-11 12:23 |
Ah I see, thank you for the explanation. |
| |
 Screenshot 2025-07-03 at 1.47.46 PM.png
 Screenshot 2025-07-03 at 1.48.23 PM.png
 Screenshot 2025-07-08 at 2.32.53 PM.png
 Screenshot 2025-07-10 at 10.22.55 AM.png
 Screenshot 2025-07-10 at 10.26.39 AM.png
 Screenshot 2025-07-10 at 10.33.04 AM.png
 Screenshot 2025-07-10 at 11.52.19 AM.png
 Screenshot 2025-07-11 at 10.19.38 AM.png
 Screenshot 2025-07-11 at 10.20.18 AM.png
 Screenshot 2025-07-11 at 10.23.00 AM.png
 Screenshot 2025-07-11 at 10.26.23 AM.png
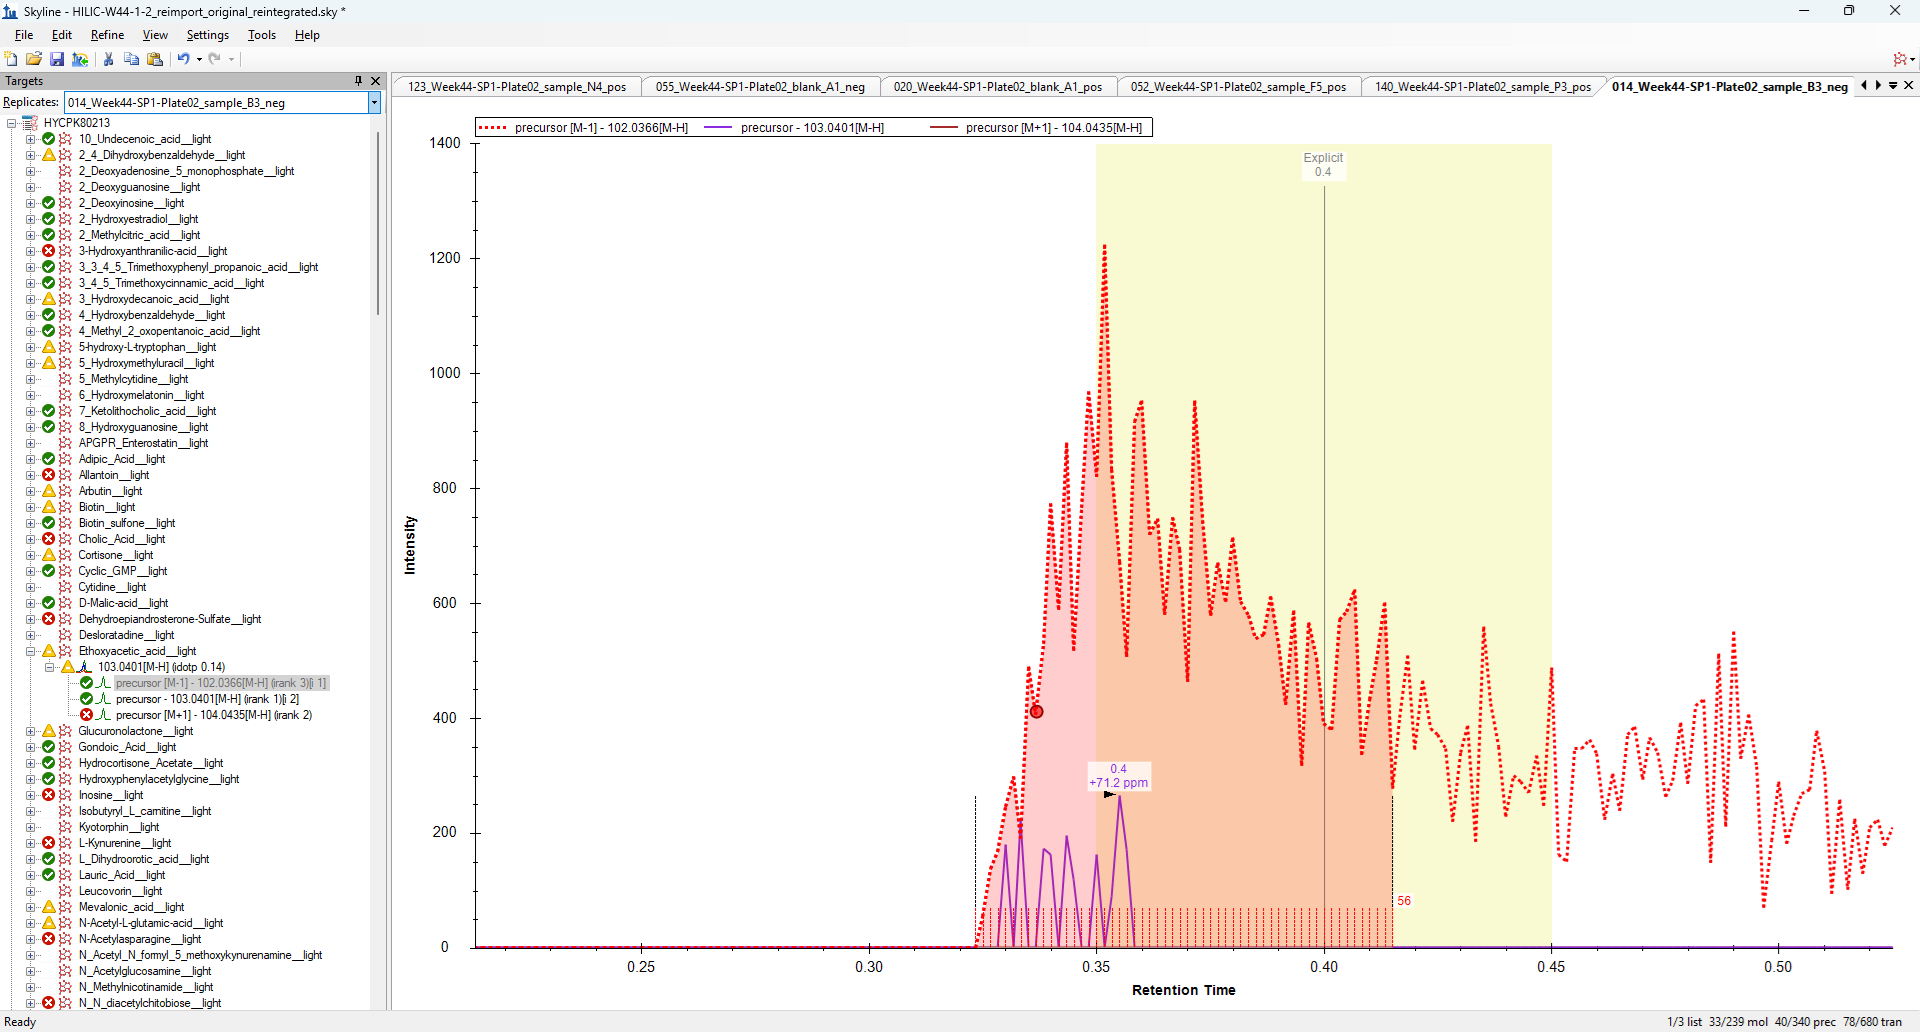 M-1Chromatogram.png