Skyline 25.2 will have a new feature "Peak Imputation" which will improve several scenarios where Skyline has traditionally chosen incorrect peaks.
As of July 30, 2025, this feature is not yet part of Skyline-daily, but can be used in a special build:
https://proteome.gs.washington.edu/~nicksh/SpecialSkylines/PeakImputation/
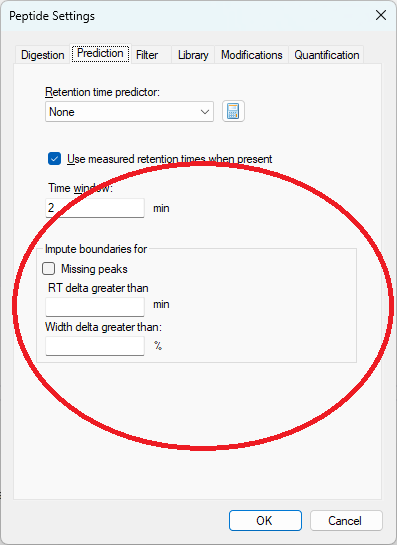
The new peak imputation settings can be found on the "Prediction" tab in Peptide Settings
The peak imputation settings tell Skyline that in certain circumstances, the peak boundaries should be chosen instead based on the peak boundaries in the best-scoring replicate for that peptide or molecule.
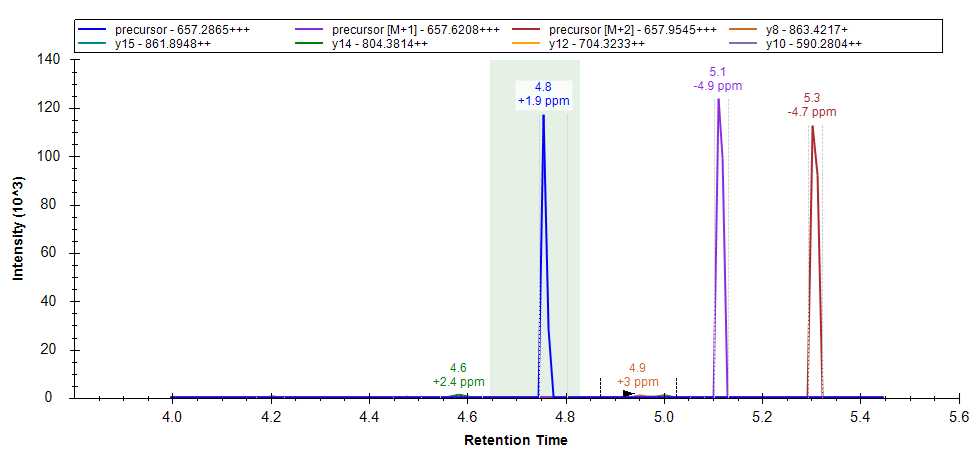
The chromatogram graph displays as a green-shaded rectangle, the peak boundaries from the best-scoring replicate. This rectangle can be shown/hidden by toggling the "Exemplary Peak" menu item on the chromatogram graph context menu.
Instead of using the exact peak boundaries from the best-scoring replicate, Skyline performs a retention time alignment to map the times from the best-scoring replicate to the target replicate. By default, if there is an iRT calculator in the document, then the iRT calculator is used to do the alignment. If there is no iRT calculator, then runs are aligned using a lowess regression against the median retention time values from the first spectral library in the document. If the document has no iRT calculator or spectral libraries, then no alignment is performed by default. There is a "run-to-run alignment" dropdown in the imputation settings where a different alignment can be chosen, including aligning against the median retention times from the chosen peaks in the chromatograms in the document.
The "Exemplary Peak" column shows the peak boundaries from the best-scoring replicate in the document or run in the library. It has the following sub-columns:
| Name | Description | Type |
|---|---|---|
| Exemplary Retention Time | Normalized retention time of the apex of the best-scoring peak | Double |
| Exemplary Start Time | Normalized start retention time of the peak from the best-scoring replicate or library file | Double |
| Exemplary End Time | Normalized end retention time of the peak from the best-scoring replicate or library file | Double |
| Exemplary Score | Score of the highest scoring peak in either a replicate or a library | Double |
| Exemplary Replicate Name | Name of the replicate with the best-scoring peak | String |
| Exemplary Library Name | Name of the library with the best-scoring peak | String |
| Exemplary File Path | File path of the result file with the best-scoring peak | String |
The "Imputed Peak" column shows where in the current replicate the boundaries of the Exemplary Peak align to. It has the following sub-columns:
| Name | Description | Type |
|---|---|---|
| Imputed Start Time | Start time of the peak from the best-scoring replicate mapped using retention time alignment to this replicate | Double |
| Imputed End Time | End time of the peak from the best-scoring replicate mapped using retention time alignment to this replicate | Double |
The "Original Peak" column shows where Skyline decided that the best-scoring peak was, before peak imputation. If peak imputation decides to move the peak boundaries, or, if the user chooses another peak, the Original Peak remains the same.
When the "Refine > Reintegrate" menu item is used to choose new peak boundaries using a trained peak-scoring model, the "Reintegrated Peak" column will show the boundaries chosen by the peak scoring model. If the "Refine > Reintegrate" menu item is used with the "Default" scoring model, then the "Reintegrated Peak" will still be empty, and the "Original Peak" values will change to reflect the peaks chosen by Skyline's default peak scoring model.
| Attached Files | ||
ImputedBounds.png PeakImputationSettings.png
| previousnext |
| expand allcollapse all |